




Annual
$199per month, billed annually
A yearly check-up. Know where you stand and what to fix first.
Book a demoReins uses your QuickBooks or ServiceTitan data to show what's holding your business back and what you can do to grow its value.
Based on real business sales
See how every number was calculated
Setup takes minutes
Customers see a 39% increase in company value in 24 months


in partnership with industry leaders







and the networks behind them

HVAC & Plumbing · TX

HVAC & Plumbing · FL

Home services · CO

Electrical · PA

HVAC · GA

Electrical · VA

Plumbing · FL

Garage doors · WV

Construction · OR

Home services · FL

Plumbing · TX

Glass · TX

HVAC & Plumbing · TX

HVAC · WV & PA

Plumbing · UT

HVAC · CA

HVAC & Plumbing · MA

Landscaping · OR

Restoration · IL

Electrical · TN

Electrical · NC

Plumbing ·

Electrical · Multiple

HVAC & Plumbing · CA

Roofing · Canada

Landscaping · CA

Pest control · Multiple

Home Services · CA

HVAC · MN

Restoration · Oregon

Construction · CA

Restoration · CA

HVAC & Plumbing · GA

HVAC & Plumbing · MI

Garage doors · IL
See more
CustomersGeneric benchmarks can't tell you what's happening inside your business. Reins reads your books and field data, so every recommendation comes from how your company actually runs.
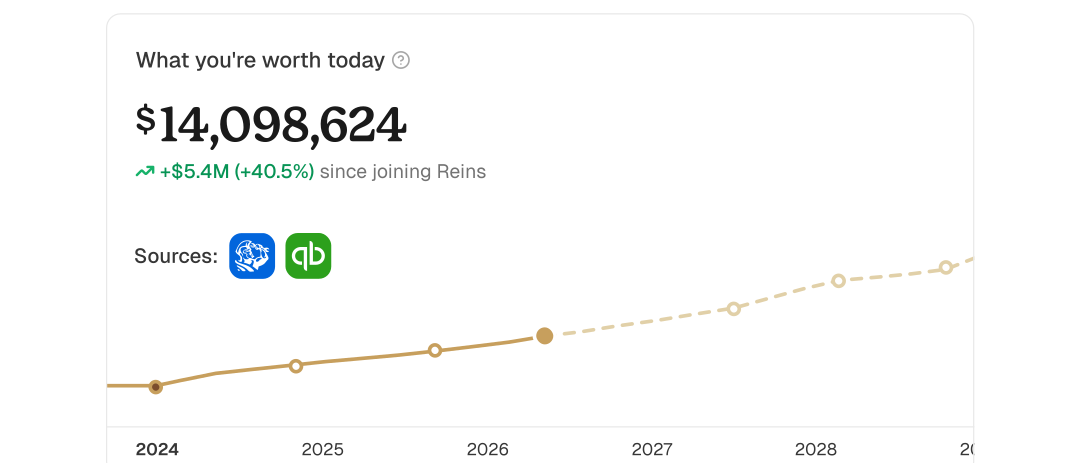

Connect QuickBooks or ServiceTitan in minutes. Use different accounting software? Just send us your financials.
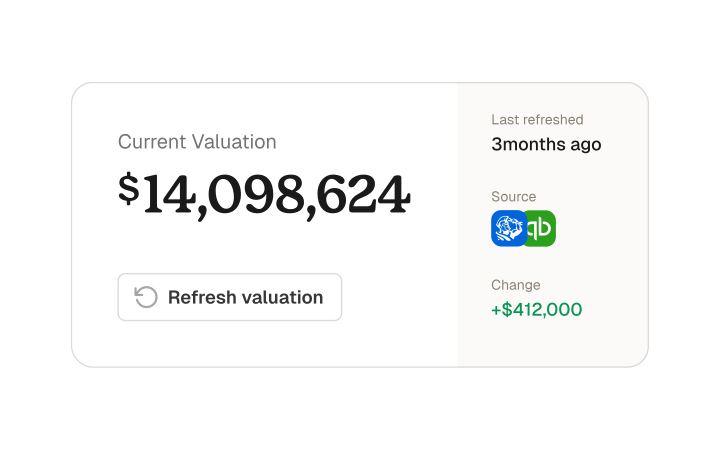
Every new valuation pulls your latest data, so you can see whether the business changes you made are actually working.
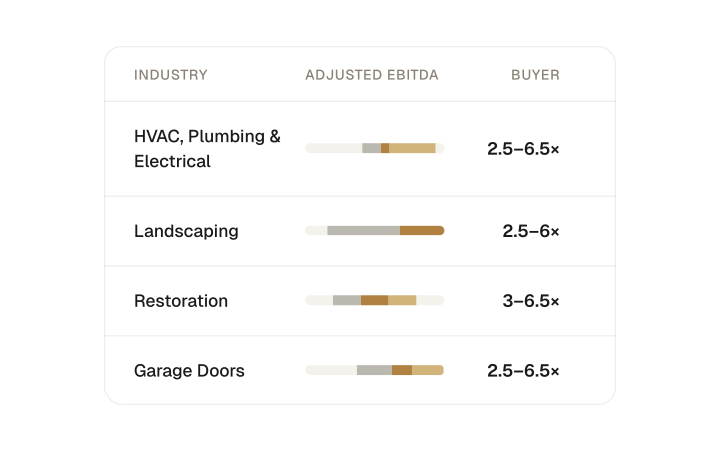
Your value is based on what businesses in your trade actually sold for, using real sale data, not a rule-of-thumb multiple.
Reins finds the weak points in your business, shows you how to fix them, and how each fix impacts your valuation.
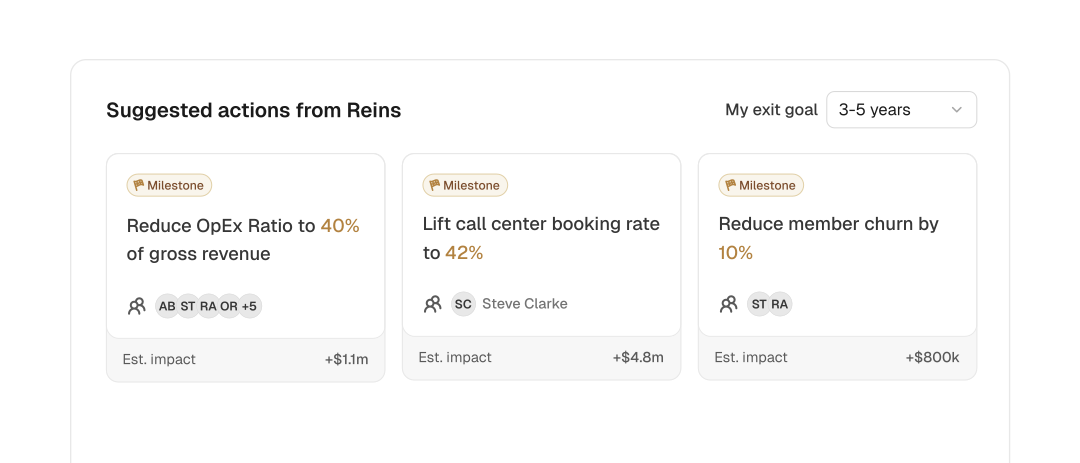
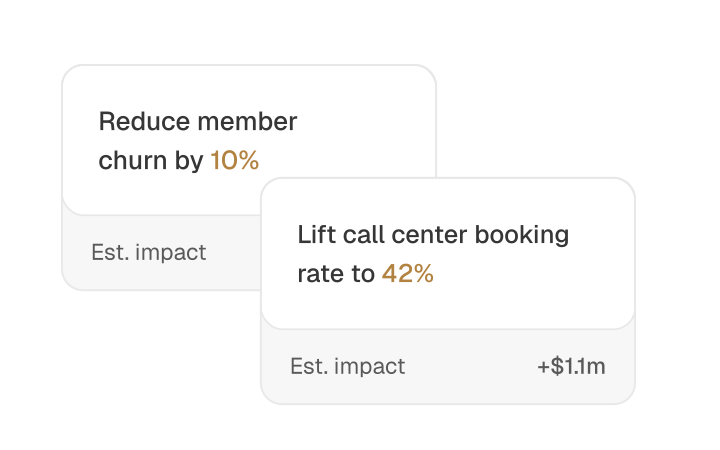
See what each move is worth before you commit to it, so your time goes to the fixes that pay the most.
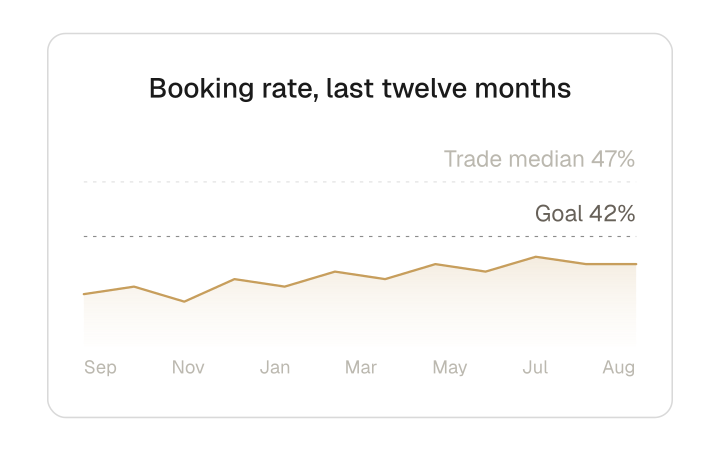
Reins spots problems in your ServiceTitan and QuickBooks data that a P&L alone won't show you.
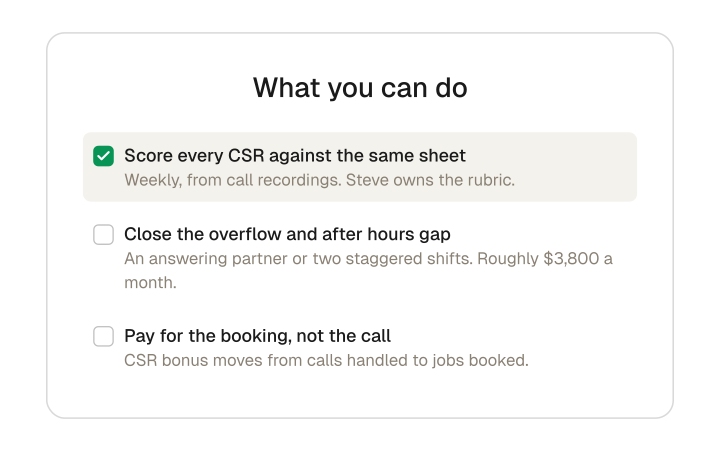
Every recommended action is specific to your business, with targets set from your own numbers and the steps to hit them.
See how every metric in your business stacks up against your peers, and exactly where you're ahead or behind.
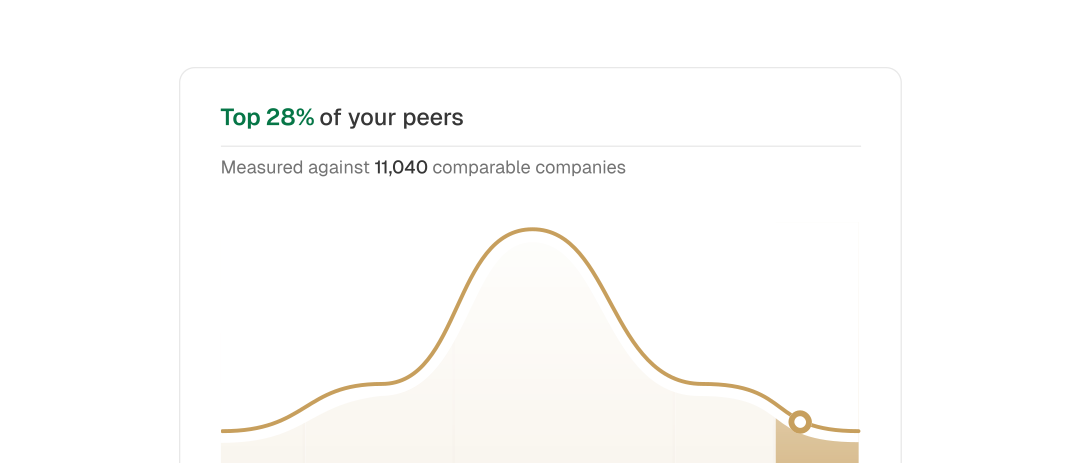
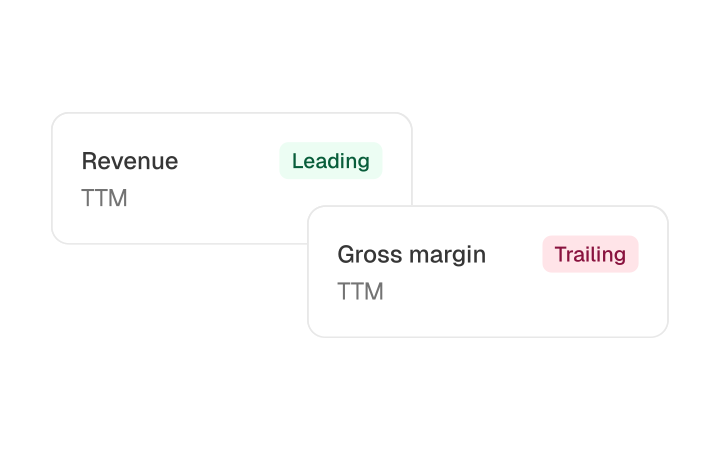
Peers are matched on trade, size and location, so you're compared with companies that actually look like yours.
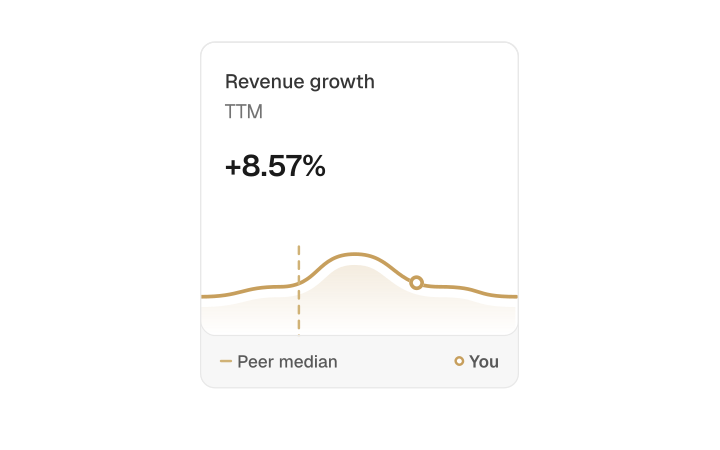
From margins to booking rate, see where you rank on every metric we track.
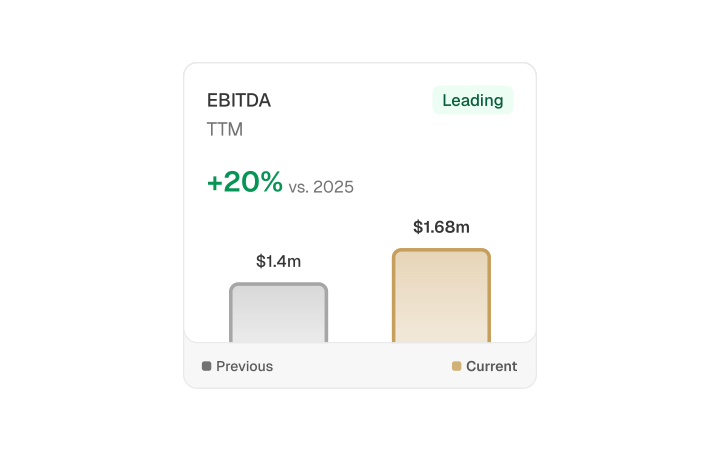
Track every metric across updated valuations and see which moves actually paid off.
Median increase in company value for Reins customers after 24 months
+39%

“Reins does an awesome job of taking a difficult subject and making it easy.”

“Absolutely, Reins has met our expectations. It was a breeze… very easy to get it going.”
How it works
Valuations come from your own books and real market data, and you can see how everything was calculated.
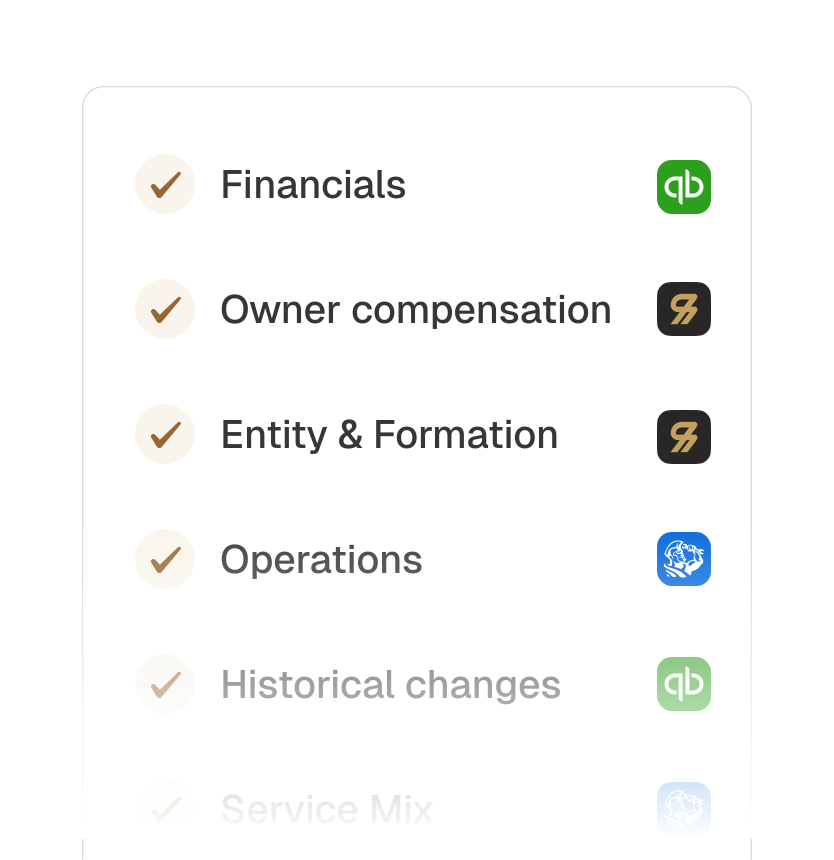
Read-only and encrypted. Using another accounting platform? Send us your financials instead.
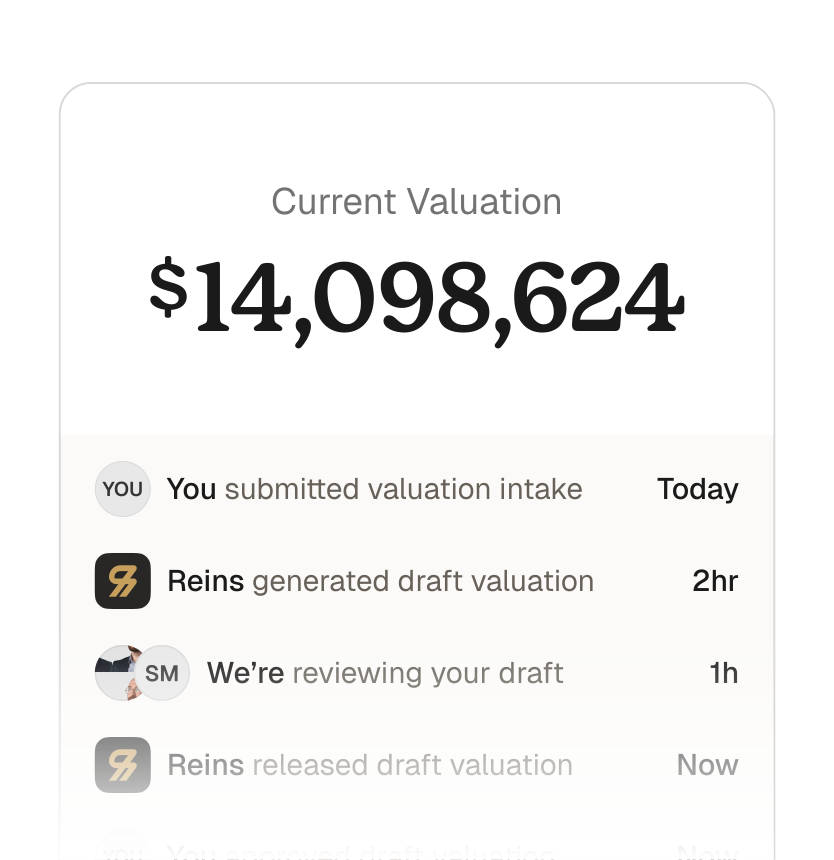
What similar businesses actually sold for, what your future earnings are worth, and what you own minus what you owe. Then we blend them into one number.
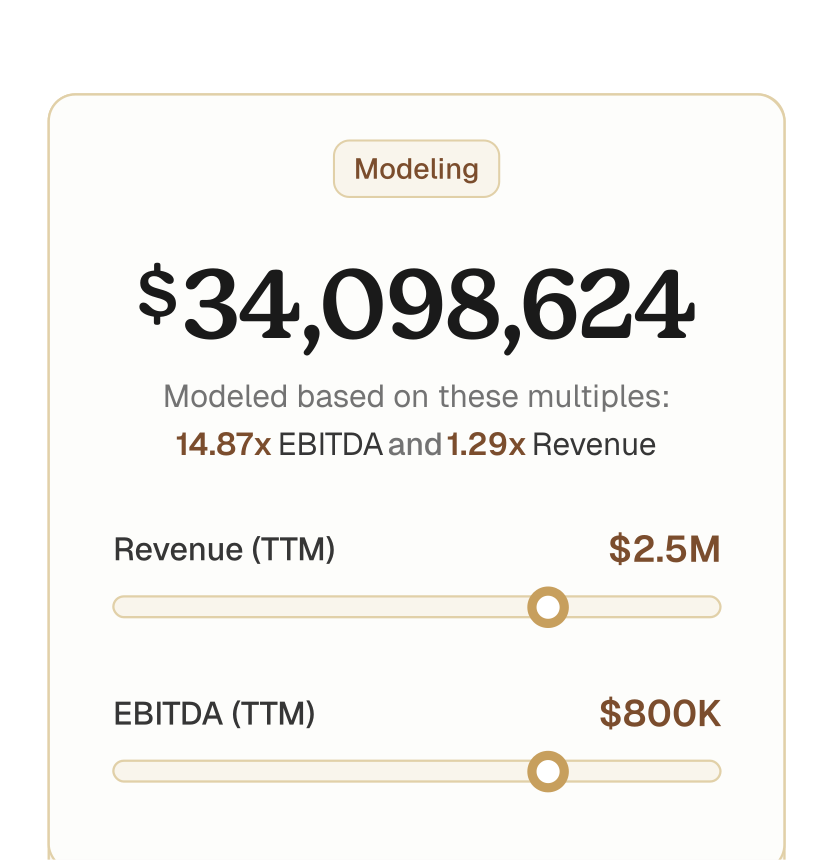
Each figure traces back to your own books or a named data source, so you can see exactly how we got there.
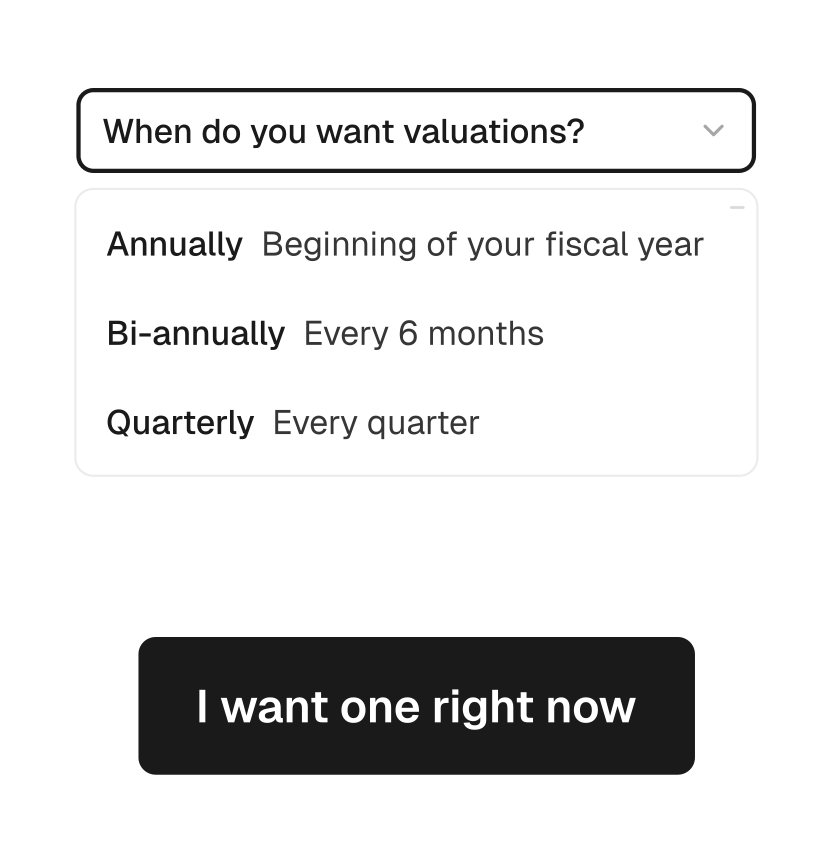
Model a change like booking rate or EBITDA and watch your valuation move.
Built on data from

BVR DealStats
Real business sale prices

Kroll
Industry risk data

Federal Reserve
Long-term growth outlook

Bureau of Labor Statistics
Wage benchmarks
How it compares
reins valuation pricing
Your growth plan and valuation, refreshed on a cadence you choose.
$199per month, billed annually
A yearly check-up. Know where you stand and what to fix first.
Book a demo$299per month, billed annually
For owners working the plan. See what moved and why.
Book a demo$399per month, billed annually
For owners pushing hard on growth. Always know your next move.
Book a demoThe whole Reins bundle. Broken down by plan, side-by-side
Everything in each Valuation plan, side by side.
Where your business is leaving money on the table, how you compare to companies in your trade, and a ranked list of next steps with the estimated impact of each one. You also get a defensible valuation, so you can track the results over time.
Your books show what you earn and spend. ServiceTitan shows how the work actually gets done. Together they let Reins find growth opportunities a P&L alone can't. QuickBooks (or your financials) is all you need to start. ServiceTitan adds the operational picture.
Yes. Reins connects with read-only access, protects your data with bank-level encryption, and keeps your numbers confidential.
48 hours after you connect your books. If you send us your financials manually, a few days.
It's a real valuation. Reins builds a defensible number from your actual financials and field service data, benchmarked against real companies in your trade and reviewed by a person before it reaches you.
Plans are $199, $299 or $399 per month, billed annually, depending on whether you want your growth plan and valuation refreshed once a year, twice a year or every quarter.
Connect QuickBooks or ServiceTitan to see what's holding your business back and what you can do to grow its value.