Valuation

Understand what your business is actually worth

Thousands of data points analyzed by AI

Industry multiples and broker opinions cloud real valuations. Reins delivers an audit-ready valuation based on your company's financials and FSM data.
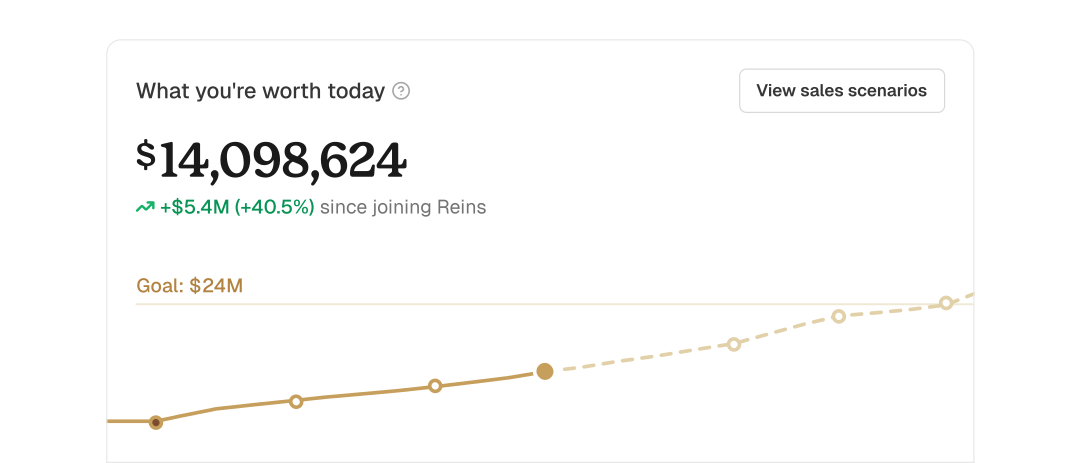

The Reins dashboard: what you're worth today at $14,098,624, up $5.4M or 40.5% since joining Reins, against a $24M goal, with the valuation history rising toward it.
Three app tiles side by side: ServiceTitan, Reins and QuickBooks.

Connected to the tools you already use

Reins analyzes your real financial and FSM data to show you what your business is worth.
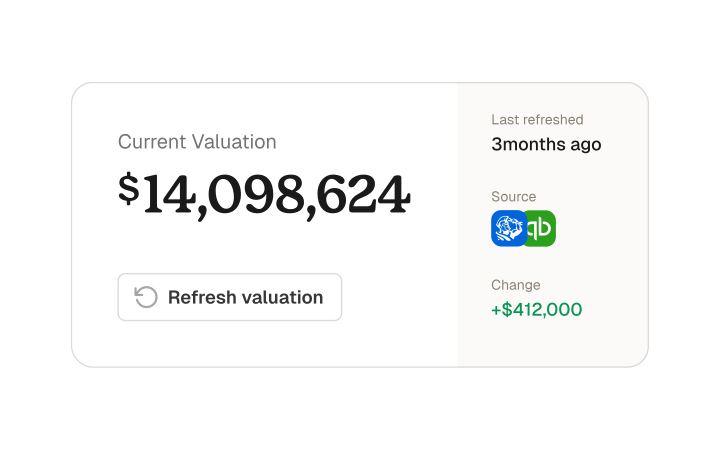
A current valuation card reading $14,098,624, last refreshed three months ago from QuickBooks and up $412,000, with a refresh valuation button.

Get quarterly updates to see what changes

See how your valuation changes over time and get the insights to grow it.
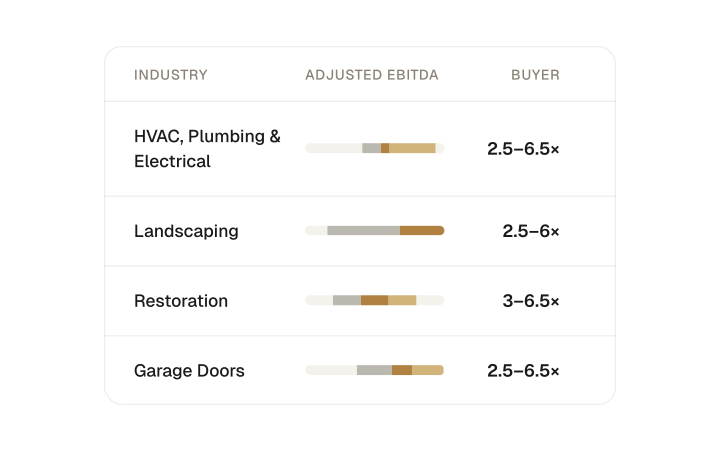
A table of valuation multiples by trade, from HVAC, plumbing and electrical through landscaping, restoration and garage doors, each with its adjusted EBITDA range and the higher multiples strategic, roll-up and platform buyers pay.

Benchmarked against your trade

Valuations are based on real data across your specific industry.

See how you stack up against your peers

Compare your business metrics like gross margin, EBITDA, and more against real companies in your industry.
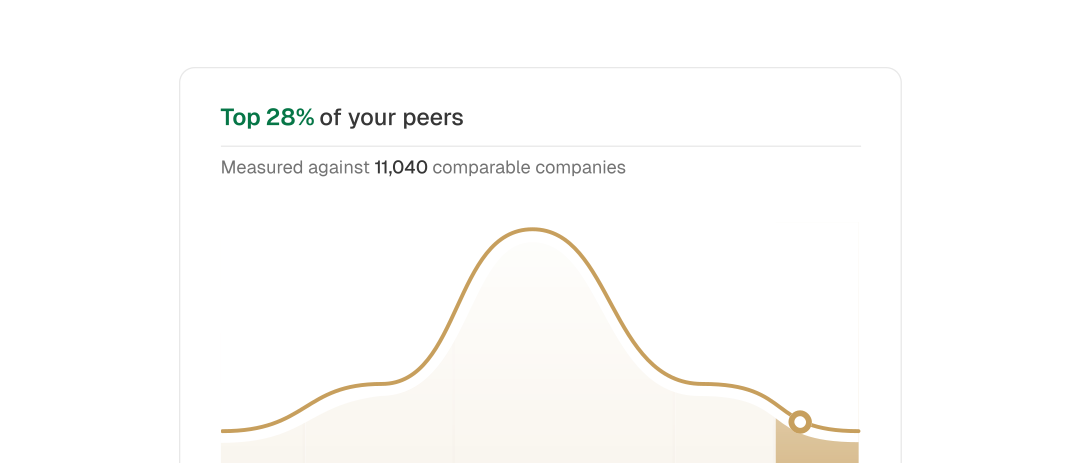
A distribution curve of businesses in the trade, from trailing through behind, on par and ahead to leading, with this business marked in the leading band.
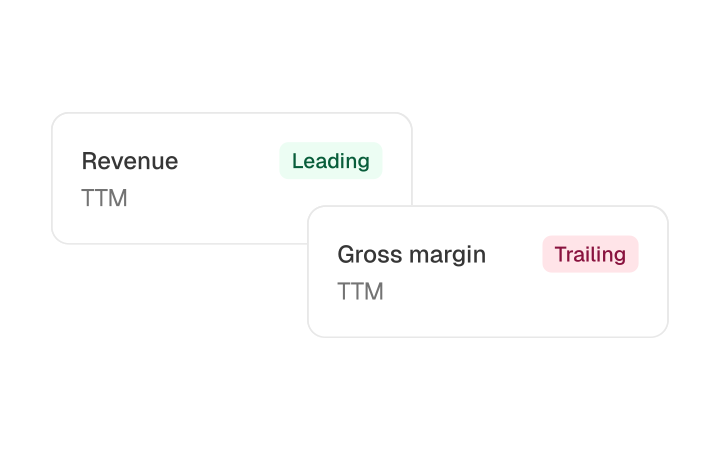
Two driver cards: revenue for the trailing twelve months, badged leading, and gross margin for the trailing twelve months, badged trailing.

Get comparables from your trade

HVAC against HVAC, at your revenue, in your region. See where you lead the pack and what metrics you're falling behind on.
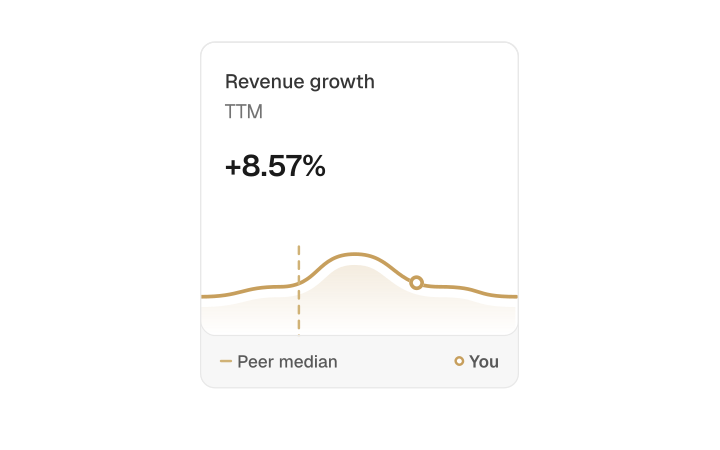
A revenue growth card reading plus 8.57% for the trailing twelve months, with this business's line running above the peer median.

See where you rank on each metric

Compare numbers like revenue growth, customer concentration, and owner dependency against businesses like yours.
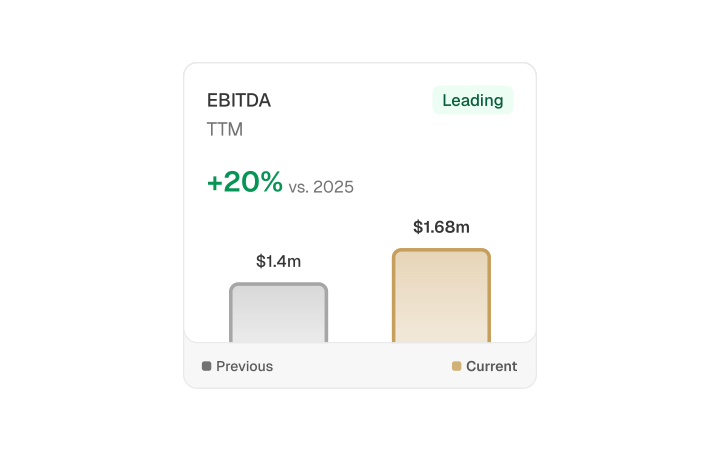
An EBITDA card badged leading and up 20% against 2025, with bars comparing $1.4m previous to $1.68m current.

Track changes over time

See how much and how far you've grown between valuations to see if what you're doing is actually working.

Understand your biggest growth opportunities

We'll show you what impacts your valuation the most, and surface insights to grow that number.
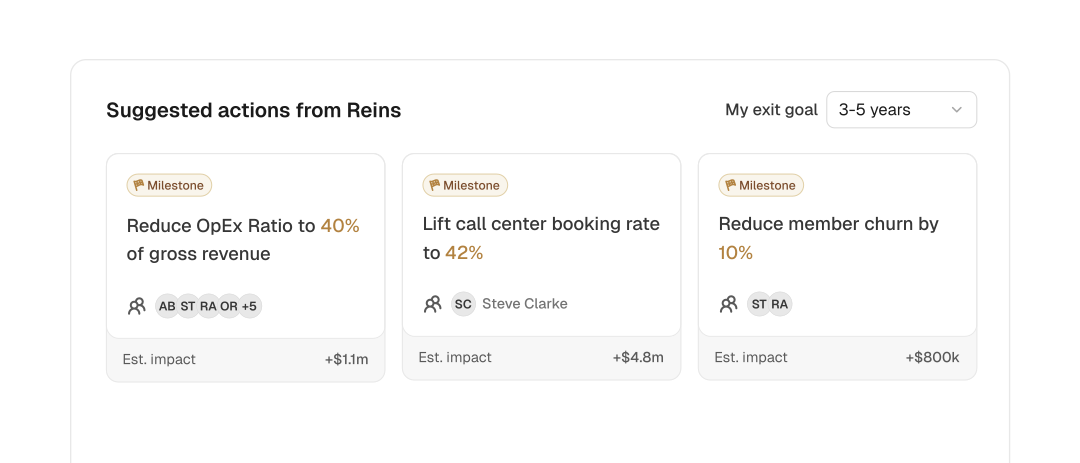
A row of milestone cards, each with the people on it and its priced impact: reduce OpEx ratio to 40% of gross revenue at $1.1m, lift call center booking rate to 42% at $4.6m, and reduce member churn at $800K.
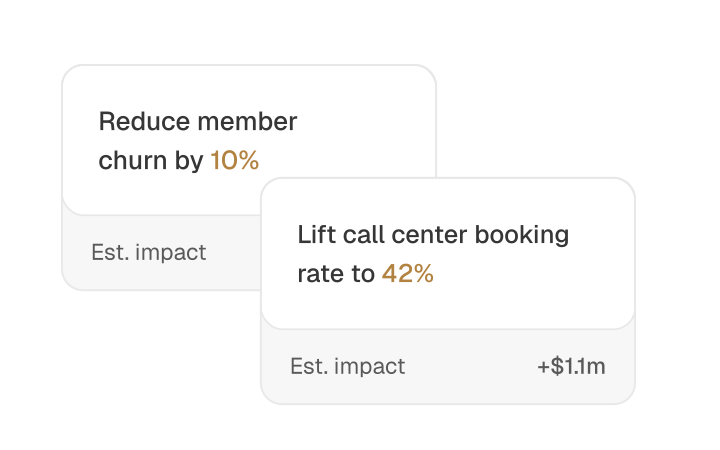
Two milestone cards with their estimated impact: reduce member churn by 10%, and lift call center booking rate to 42% at $1.1m.

Next steps ranked by valuation impact

Get clarity on the actions you can take to increase business value. See how each action impacts your valuation.
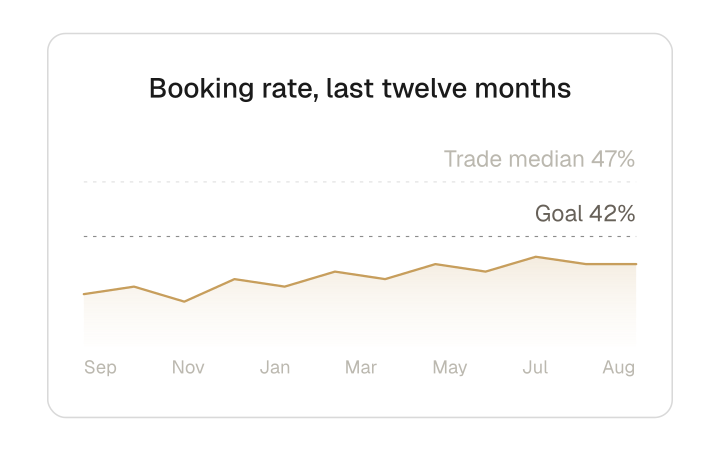
Booking rate over the last twelve months, September to August, against a trade median of 47% and a goal of 42%.

Based on your unique operations

Reins connects to the tools you use and surfaces insights based on how your business actually runs.
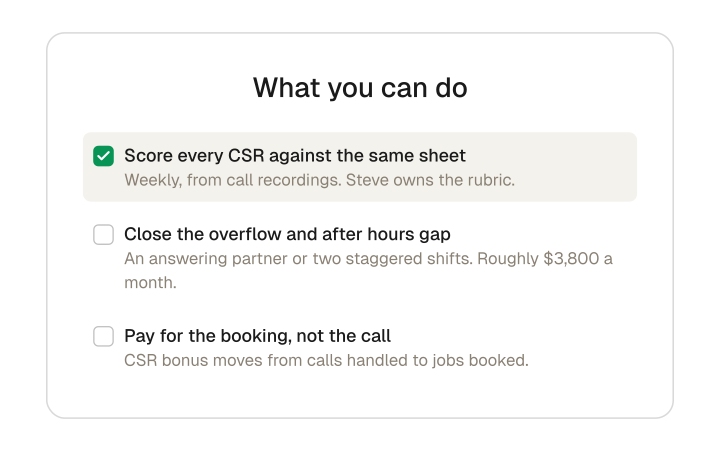
A what you can do checklist: score every CSR against the same sheet, ticked, then close the overflow and after hours gap, then pay for the booking rather than the call, each with what it takes.

A growth plan tailored to your business

Real steps you can take to meet your growth goals faster.

How it works

Where the number comes from
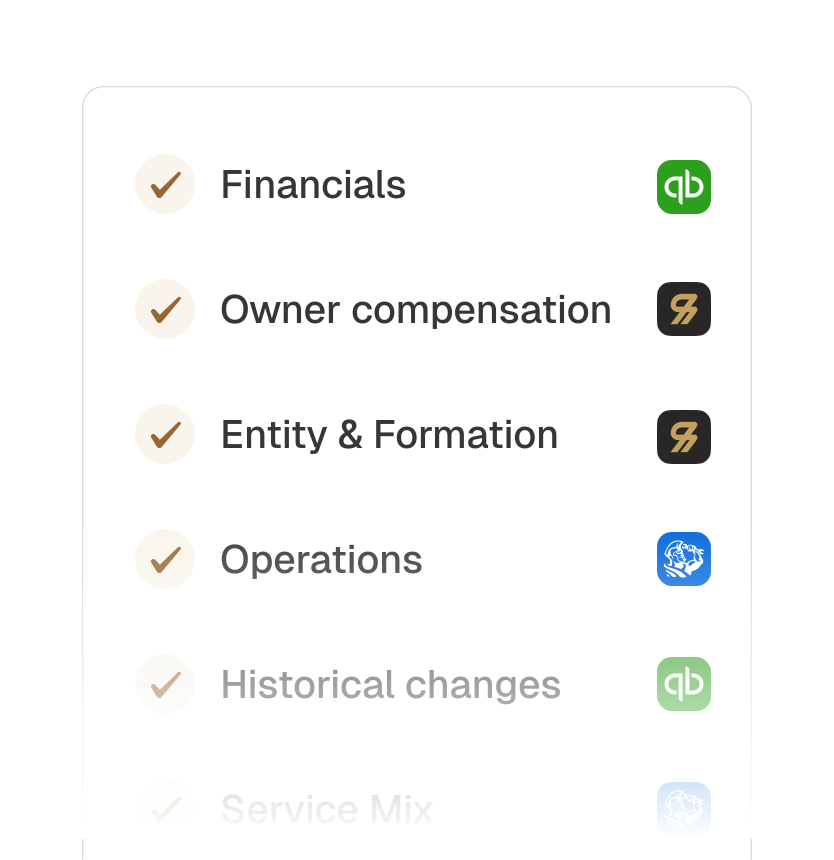
See how it works
  1. A checklist of business facts filling in on its own, each row labelled with the source it was pulled from.

    Reins AI agents compile the facts

    Agents pull in data from your industry and your tools. Your data is protected with bank-level encryption and read-only access.
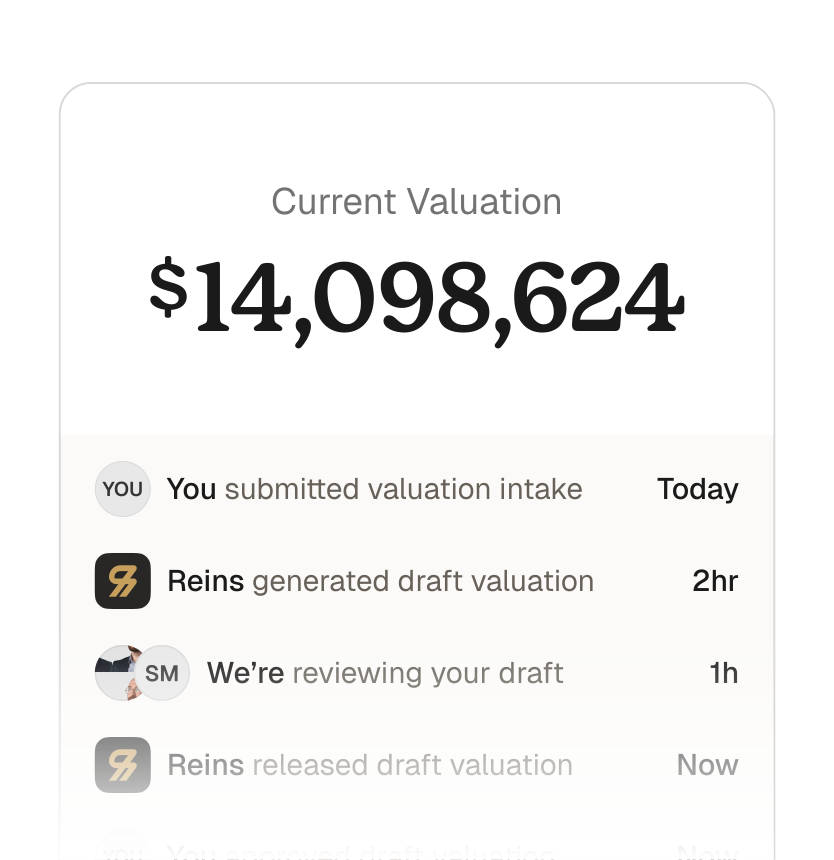
  2. An estimated business value with a review bar beneath it naming the analyst who checked it and the date.

    Valuations are generated and human reviewed

    Built from facts on your business, then hand-reviewed by real people before it reaches you.
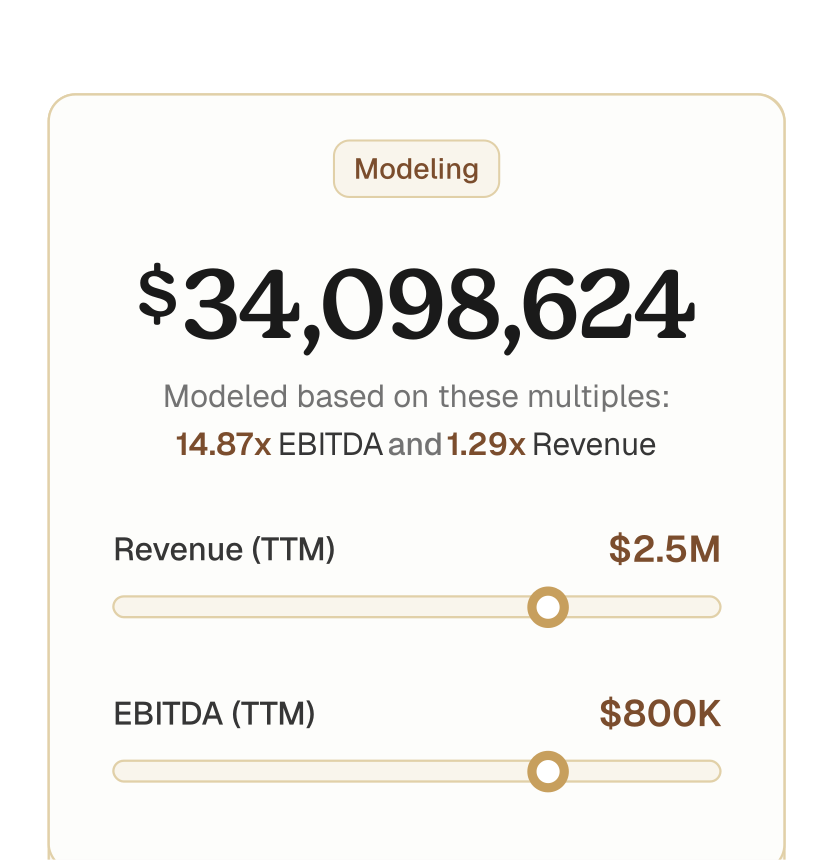
  3. A margin slider being adjusted, with the estimated value above it moving up from its previous figure.

    Model a change and see the number move

    See what levers drive your valuation and model every possible scenario.
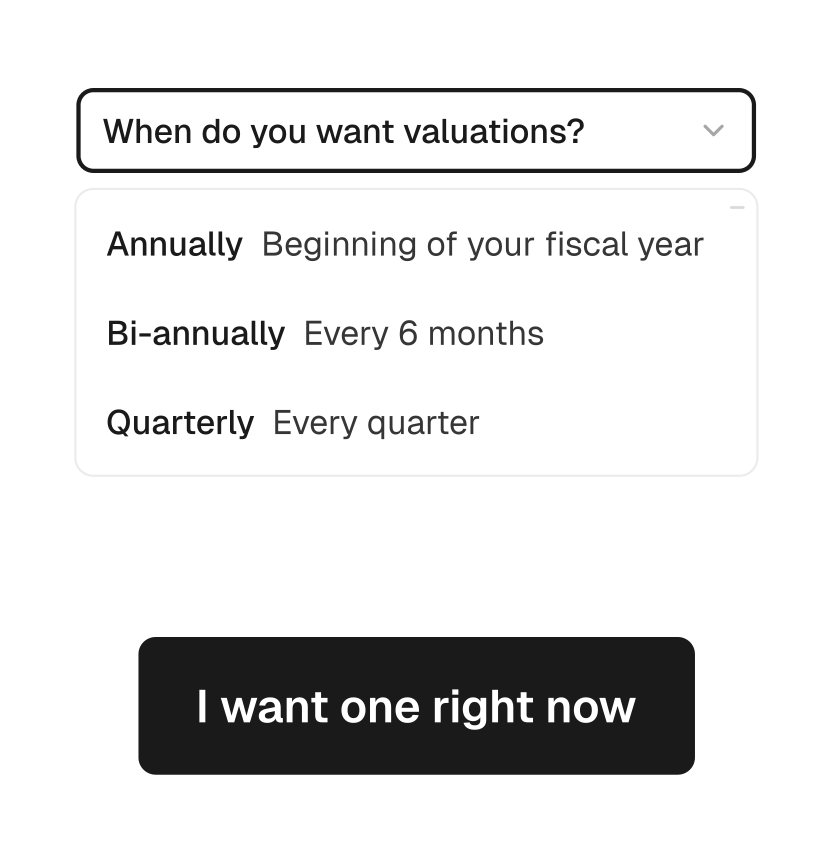
  4. A refresh cadence set to quarterly, above a timeline of past refreshes and the next one scheduled.

    Get regular updates to your valuation

    Monthly, quarterly, or annual valuations to see changes over time and what your next steps are.

See what your business is actually worth and how you can grow it